
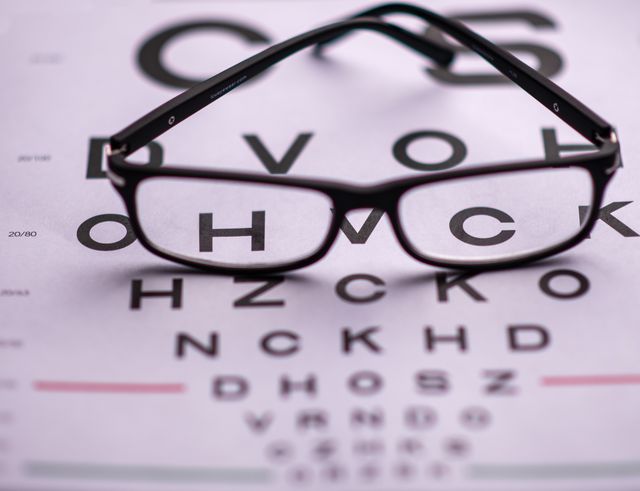
Who invented the first eye chart? The first widely used eye chart was invented by a Dutch ophthalmologist called Herman Snellen. The earliest eye charts were invented in the early 19th century, but Snellen’s chart was the one that became the standard.
The majority of people will have used an eye chart at some time. Eye doctors and opticians use them as a way to gauge the sharpness of a person’s vision, which is called visual acuity. The most straightforward one, at least in the English-speaking world, is a chart consisting of random letters. Each line of letters gets smaller as you go down the chart. Standing a certain distance from the chart, the person testing your eyes can tell by the line of letters you can read how good your eyesight is. A chart called the tumbling E was invented for people who cannot read or for children who don’t know the alphabet yet. The chart has capital Es pointing in different directions and decreasing in size. The person looking at the chart can say which direction the fingers of the E are pointing. Some charts also have a circle with a section cut out of it. This is called the Landolt C. Similar to the tumbling E, people can say in which direction the missing piece of the circle is pointing.
The eye chart was invented when it was because of a number of societal changes. Before the early 19th century, most people lived in the countryside and worked the land. If they couldn’t see very well, there was not much they could do about it, so they just learned to cope. It is possible to work the land or farm cows without having perfect vision. Once countries industrialized and people moved into cities, good eyesight became more necessary. Railroad engineers, office workers, and some factory workers all needed to be able to see clearly. The second change was the reduction in the cost of vision-correcting glasses. Glasses had existed for several hundred years, but they had to be made by hand and they were expensive. Only the wealthy could afford them. Once machines to make the parts were invented, and ways of making glass were improved, glasses became something that more ordinary people could afford. Being able to see clearly suddenly became a thing that was possible.
Many countries had glasses, but the Netherlands became one of the centers of ophthalmology. A Dutch ophthalmologist called Franciscus Cornelius Donders came up with a clearly defined system for correcting eyesight. He worked out ways to measure the sharpness of vision and connect that measurement to the lenses needed to correct the vision. He was so famous that people traveled from far and wide to see him. Before Snellen, a German ophthalmologist called Heinrich Küchler came up with one of the first eye charts to measure eyesight. His first chart used pictures of objects that decreased in size from the top to the bottom. An Austrian ophthalmologist called Eduard Jaeger later designed a chart that had paragraphs of text in decreasing size. That kind of chart was especially useful for testing near vision and reading.
All of the eye charts that existed at this time were useful, but they were not standardized. You couldn’t easily get your eyes tested in one place and go to have glasses made in another because each ophthalmologist might have a different system for calculating the type of glasses needed. That changed when Snellen created his chart. Snellen was a student and colleague of Donders, and his chart was very simple and easy to recreate. He used special letters, called optotypes, that were designed to fit into a fixed grid. That meant the letters could be measured and scaled very precisely. Because of his connection to Donders, many eye doctors came to see Donders and also saw Snellen’s eye chart. They took the idea away with them, and it gradually became the standard system for working out visual acuity.
The eye chart also gave rise to the expression “20/20 vision”. The eye chart was designed to be viewed from 20 feet, or about 6 meters, away. If you have 20/20 vision, it means you can see at 20 feet what the average person can see at 20 feet. If you have 20/40 vision, it means you can see at 20 feet what the average person can see from 40 feet away, so your distance vision is worse than average. If you have 20/10 vision, it means you can see at 20 feet what the average person has to stand 10 feet away to see, so your distance vision is better than average.
One of the most famous claims about extraordinary eyesight is the case of Veronica Seider. In 1972, the University of Stuttgart reportedly said that she had visual acuity far better than average and could recognize people from more than 1.6 km away. Her eyesight is often described as 20/2, which would mean she could see at 20 feet what most people could only see from 2 feet away. However, claims like this are difficult to verify fully, so it is probably safer to say that she had one of the most extraordinary reported cases of human eyesight. And this is what I learned today.
Sources
https://en.wikipedia.org/wiki/Eye_chart
https://en.wikipedia.org/wiki/Franciscus_Donders
https://www.aao.org/eye-health/tips-prevention/eye-chart-facts-history
Photo by Skyler Ewing: https://www.pexels.com/photo/stylish-medical-glasses-placed-on-optotype-5754242/